mlnext.plot.plot_signals_norm
- mlnext.plot.plot_signals_norm(x: ndarray | DataFrame, y: ndarray | DataFrame | None = None, *, x_pred: ndarray | DataFrame | None = None, norm_mean: ndarray | None = None, norm_std: ndarray | None = None, path: str | None = None, return_fig: bool = False) Figure | None[source]
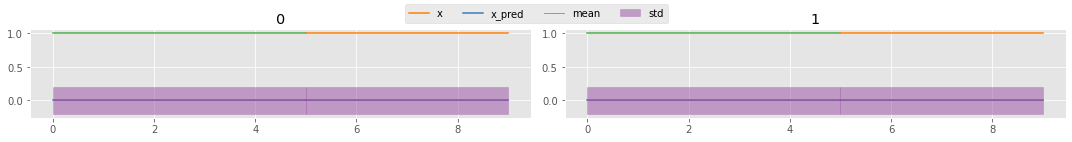
Plots the signal x in color of the label y. Optionally, x_pred is signal prediction to be plotted. Additionally, with norm_mean and norm_std a confidence interval can be plotted.
- Parameters:
x_pred (T.Union[np.ndarray, pd.DataFrame]) – Prediction.
y (T.Union[np.ndarray, pd.DataFrame]) – Labels. Default: None.
x (T.Union[np.ndarray, pd.DataFrame], optional) – Ground truth. Default: None.
norm_mean (np.ndarray, optional) – Mean of the underlying normal distribution.
norm_std (np.ndarray, optional) – Standard deviation of the underlying normal distribution.
path (str, optional) – Path to save figure to. Default: None.
return_fig (bool) – Whether to return the figure. Otherwise, plt.show() is called. Default: False.
- Returns:
Returns the figure if return_fig is true.
- Return type:
T.Optional[matplotlib.figure.Figure]
Example
>>> import mlnext
>>> import numpy as np
>>> mlnext.plot_signals_norm(
...     x_pred=np.zeros((10, 2)),
...     y=np.array([0] * 5 + [1] * 5),
...     x=np.ones((10, 2)),
...     norm_mean=np.array(np.ones((10, 2))),
...     norm_std=np.array(np.ones((10, 2)) * 0.2),
...     path='signals.png'
... )
Expected result: