mlnext.plot.plot_point_adjust_metrics
- mlnext.plot.plot_point_adjust_metrics(y_hat: ndarray, y: ndarray, *, return_fig: bool = False) Figure | None[source]
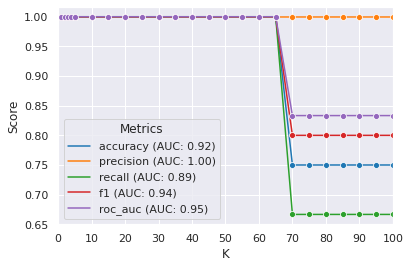
Plots
point_adjust_metrics.- Parameters:
y_hat (np.ndarray) – Label predictions.
y (np.ndarray) – Ground truth.
return_fig (bool) – Whether to return the figure (Default: False).
- Returns:
Returns the figure if return_fig=True.
- Return type:
T.Optional[Figure]
Example
>>> import mlnext
>>> import numpy as np
>>> mlnext.plot_point_adjust_metrics(
...   y_hat=np.array([0, 1, 1, 0]), y=np.array([0, 1, 1, 1]))
Expected result: