mlnext.plot.plot_error
- mlnext.plot.plot_error(X: ndarray, y: ndarray | None = None, threshold: float | None = None, title: str | None = None, yscale: str = 'linear', path: str | None = None, return_fig: bool = False) Figure | None[source]
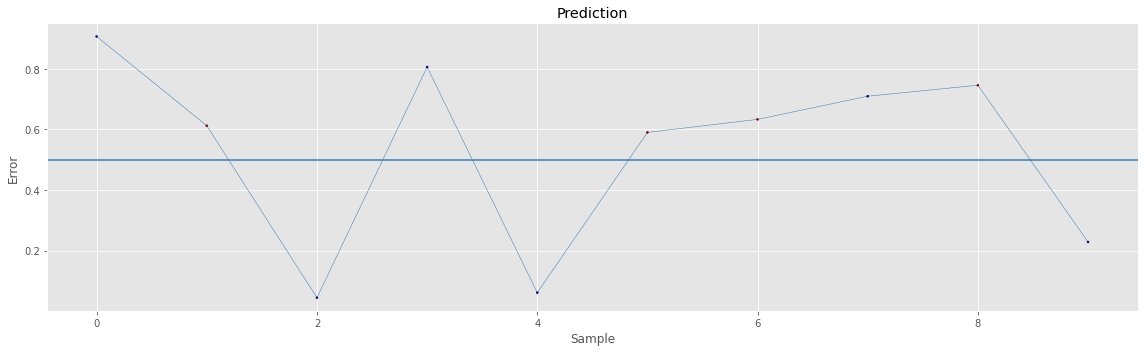
Plots the error given by x. Label determines the color of the point. An anomaly threshold can be drawn with threshold.
- Parameters:
X (np.ndarray) – 2D array of error.
label (np.ndarray) – label for data points.
threshold (float) – Threshold.
title (str) – Title of the plot.
yscale (str) – Scaling of y-axis; passed to plt.yscale. Default: linear.
save (str) – Path to save figure to.
return_fig (bool) – Whether to return the figure. Otherwise, plt.show() is called.
- Returns:
Returns the figure if return_fig is true.
- Return type:
T.Optional[matplotlib.figure.Figure]
Example
>>> import mlnext
>>> import numpy as np
>>> # Plots the predictions X in the color of label with a threshold
>>> mlnext.plot_error(
...     X=np.random.rand(10),
...     y=np.array([0, 1, 0, 0, 0, 1, 1, 0, 1, 0]),
...     threshold=0.5,
...     title='Prediction',
...     path='pred.png'
... )
- Expected result: