mlnext.plot.plot_rankings
- mlnext.plot.plot_rankings(error: ndarray, *, y: ndarray, x: ndarray, x_pred: ndarray, k=3, context=10, return_figs: bool = False) List[Figure] | None[source]
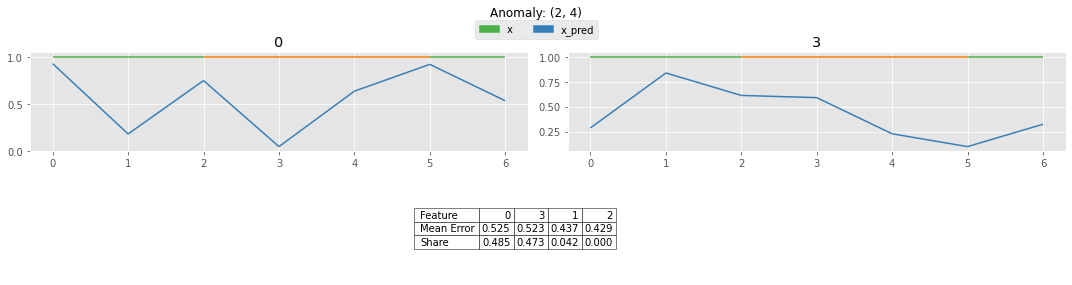
Plots the top k features (predictions x_pred and ground truth x) with the biggest error for each anomaly found in the labels y. With context additional data points to the left and right of the anomaly will be shown.
- Parameters:
error (np.ndarray) – Feature-wise error (e.g. l2_norm with reduce=False or {norm, bern}_log_likelihood).
y (np.ndarray) – Labels (1d array).
x (np.ndarray) – Input data (ground truth).
x_pred (np.ndarray) – Predictions of x.
k (int, optional) – How many features should be plotted. Defaults to 3.
context (int, optional) – Additional datapoints that should be plotted to the left and right of the anomaly. Defaults to 10.
return_figs (bool) – Whether to return the figure. Otherwise, plt.show() is called.
- Returns:
Returns a list of the figures if return_figs is true.
- Return type:
T.Optional[matplotlib.figure.Figure]
Example
>>> import mlnext
>>> import numpy as np
>>> x, x_pred = np.ones((7, 4)), np.random.random((7, 4))
>>> y = np.array([0, 0, 1, 1, 1, 0, 0])
>>> error = mlnext.l2_norm(x, x_pred, reduce=False)
>>> mlnext.plot_rankings(
...    error = error,
...    y=y,
...    x=x,
...    x_pred=x_pred,
...    k=2
... )
Expected result: