mlnext.plot.plot_history
- mlnext.plot.plot_history(history: Dict[str, Any], filter: List[str] = ['loss'], path: str | None = None, return_fig: bool = False) Figure | None[source]
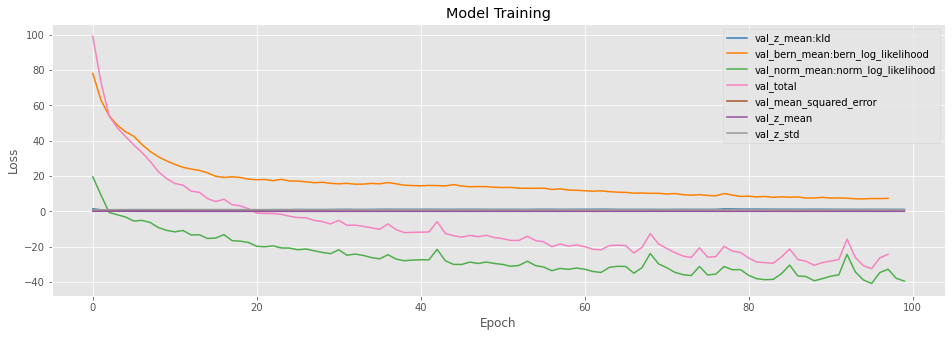
Plots the loss in regards to the epoch from the model training history. Use filter to plot metrics/losses that contain the filter words. Adapted from: https://keras.io/visualization/
- Parameters:
history (T.Dict[str, T.Any]) – Training history of a model.
keywords (T.List[str]) – Filters the history by a keyword.
path (str) – Path to save figure to.
return_fig (bool) – Whether to return the figure. Otherwise, plt.show() is called.
- Returns:
- Returns the figure if return_fig
is true.
- Return type:
T.Optional[matplotlib.figure.Figure]
Example
>>> import numpy as np
>>> # Plots the training history for entries that match filter
>>> history = model.fit(...)
>>> mlnext.plot_history(
...  history.history, filter=['val'], path='history.png')
- Expected result: